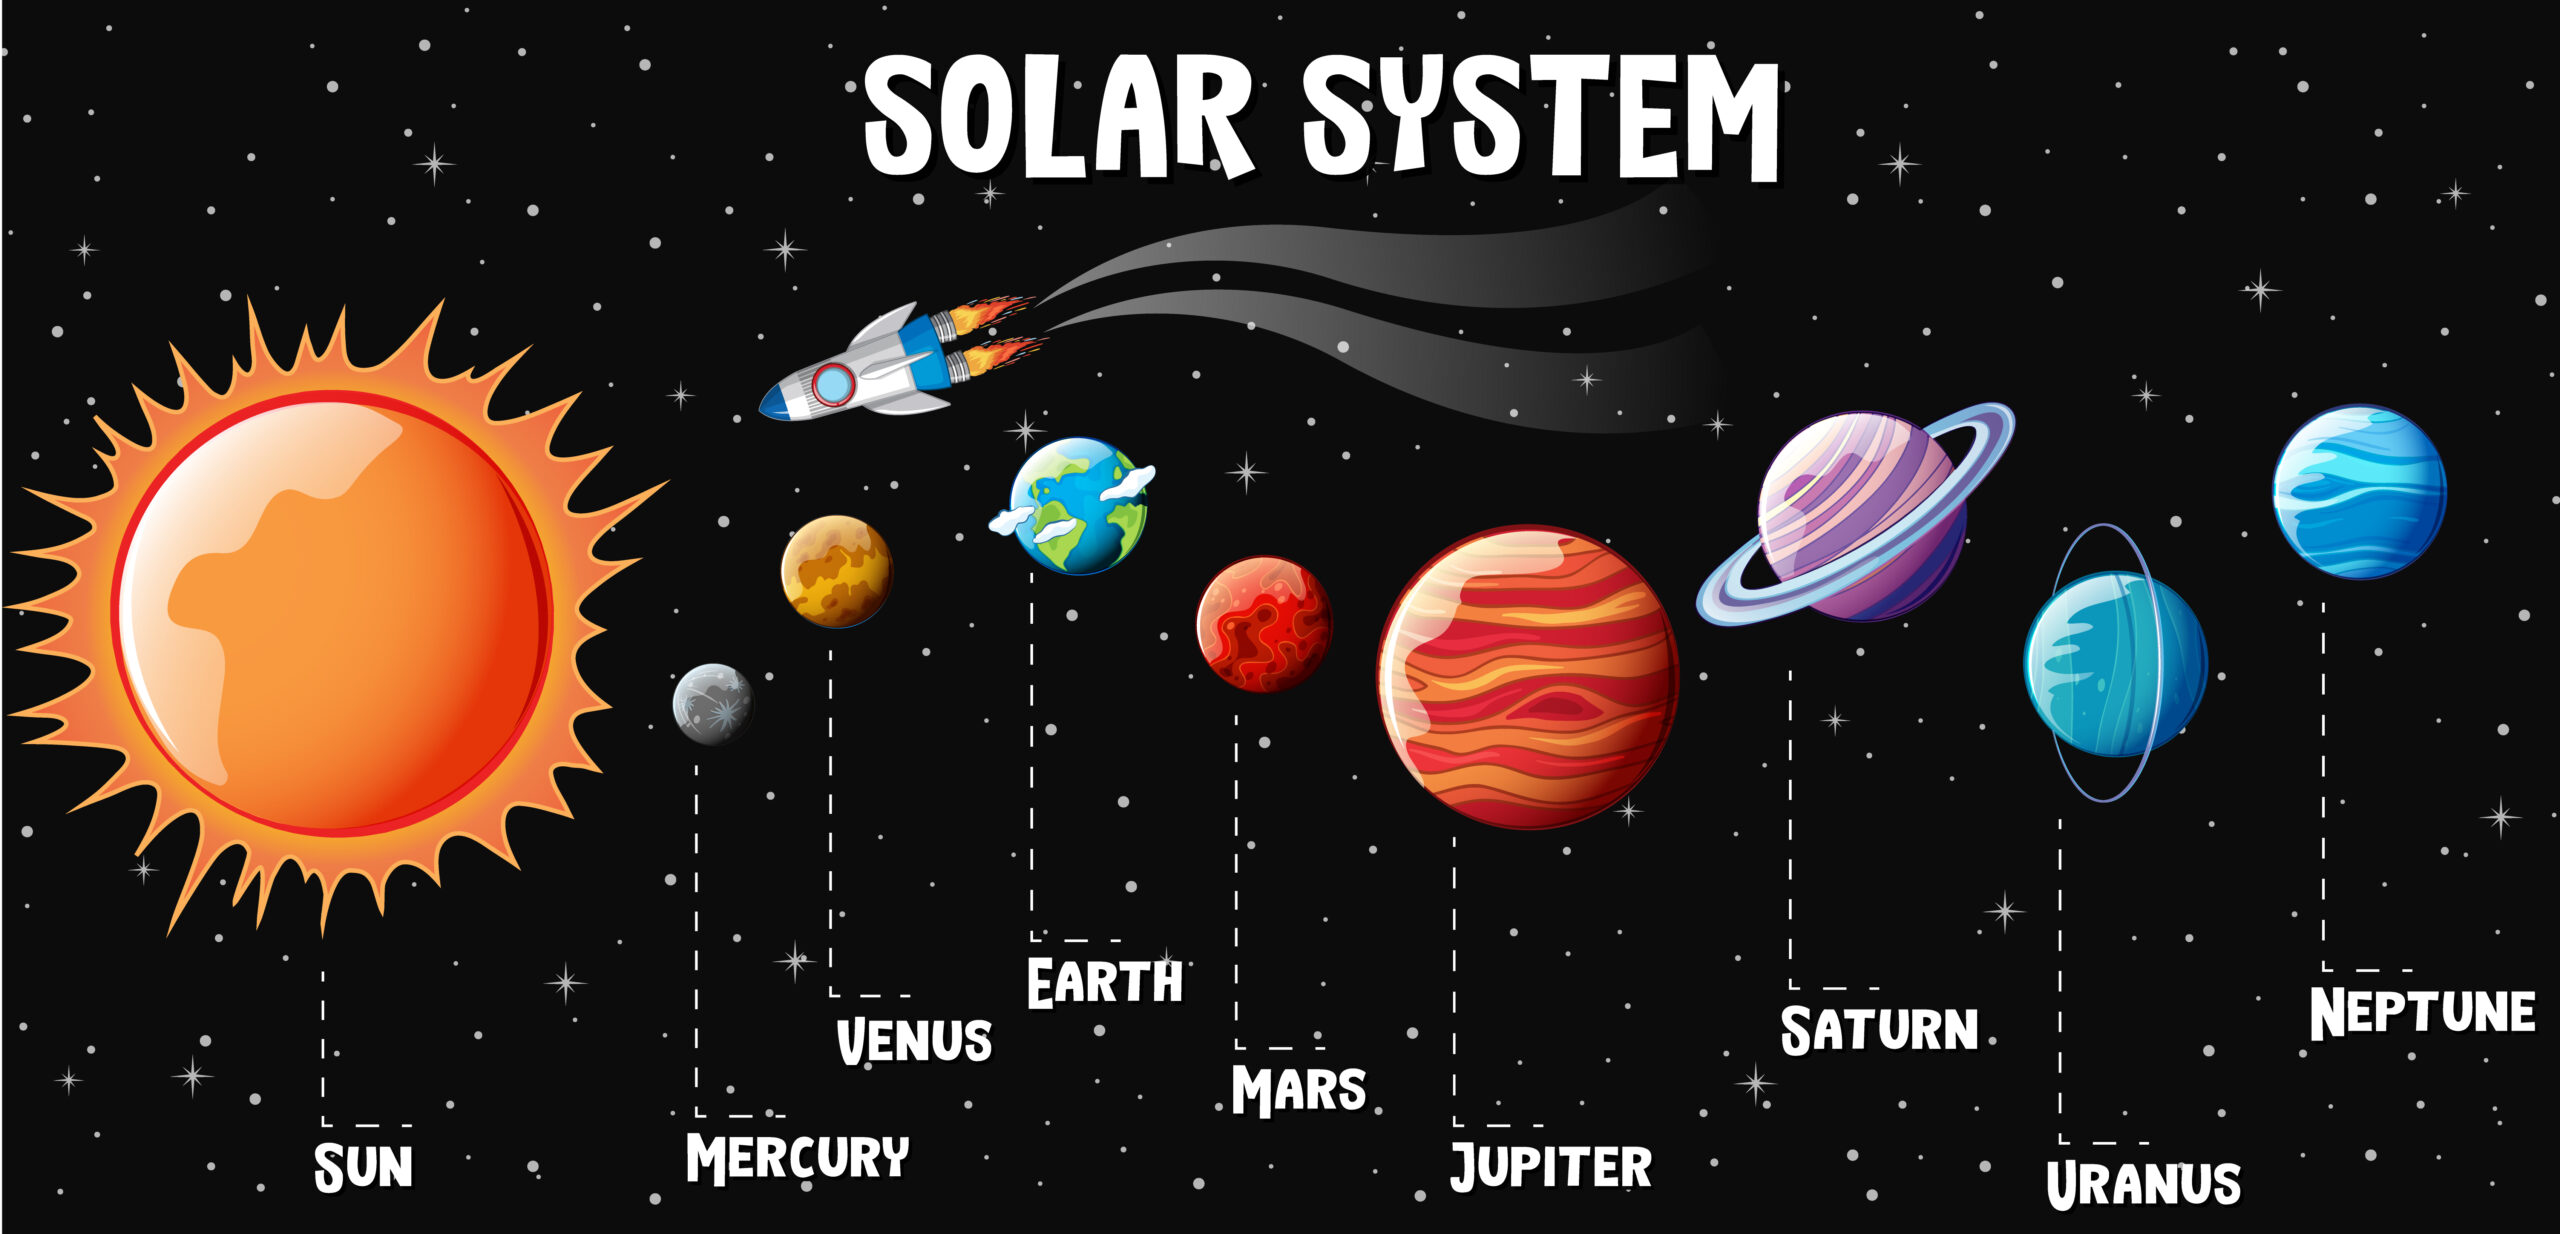
An intergalactic e-commerce company delivers gadgets to six planets across the solar system. From Laser Toasters on Mars to Invisibility Hats on Venus, sales are booming. The goal is to monitor and analyse sales data from across planets using Looker Studio to uncover trends and identify top-selling products.
You’ve just been hired as a Junior Data Analyst on their Cosmic Insights Team, and your first task is to visualize the raw order data and extract valuable insights that can help the sales and logistics teams make decisions.
📂Here’s the dataset of 50 orders from the year 2080 across planets like Earth, Jupiter, and Saturn, with sales values in galactic credits.
5 Tasks to Complete in Looker Studio
- Create a Bar Chart: Total Sales by Planet
- Objective: Compare how much revenue is generated from each planet.
- Steps: Use a bar chart, group data by
Planet, and sum theSales (Credits). - Insight: Which planet is your best-performing market?
- Build a Pie Chart: Product Distribution
- Objective: Understand which products are selling the most.
- Steps: Create a pie chart showing the count of
Product Name. - Insight: Are sales spread evenly across products, or are certain gadgets dominating?
- Design a Time Series
- With the help of the “Order Date” field, visualize trends over time. Use the name of the months for a clean look e.g January.
- Bonus: Due to some product launches or promotions some months had a rise in sales, spot the spikes in sales.
- Create a Scorecard for Top Product by Sales
- Objective: Identify the single product that brought in the most revenue.
- Steps: Use a table sorted by
Sales (Credits)in descending order; create a scorecard showing the top value. - Insight: Which product is the real star?
- Add Filters to Make Your Report Interactive
- Objective: Let viewers slice data by planet or product.
- Steps: Add dropdown filter controls for
PlanetandProduct Name. - Insight: Empower stakeholders to explore data on their own.
